PEPE Price Prediction: Analyzing the Path to Recovery in September 2025

#PEPE
- Technical indicators show PEPE trading above key moving averages with emerging bullish momentum patterns
- Market sentiment reflects consolidation at support levels despite mixed short-term signals
- Realistic price targets remain in the low decimal range rather than reaching whole dollar values
PEPE Price Prediction
Technical Analysis: PEPE Shows Bullish Consolidation Pattern
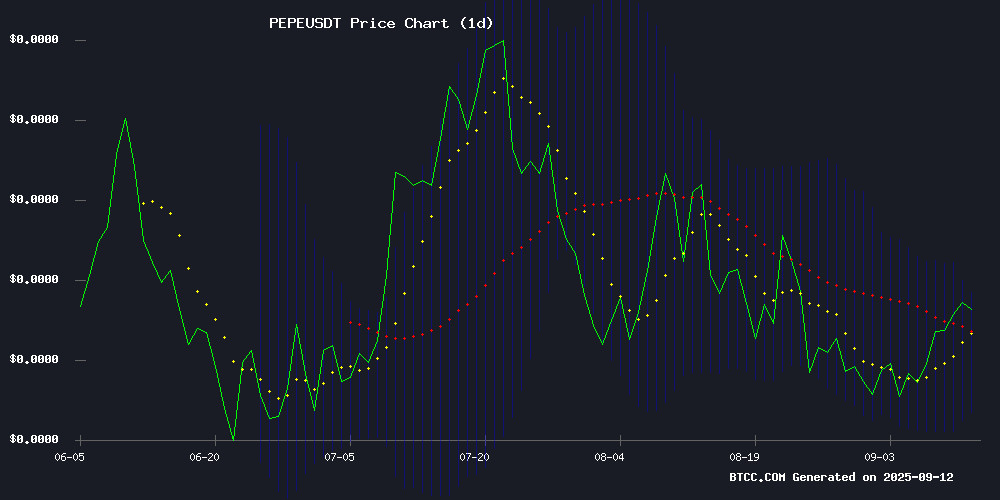
According to BTCC financial analyst Mia, PEPE's current price of $0.00001051 is trading above its 20-day moving average of $0.00001002, indicating underlying strength. The MACD reading of 0.00000010 suggests emerging bullish momentum despite the negative histogram. Price action NEAR the upper Bollinger Band at $0.00001080 shows consolidation within a bullish framework, with support firmly established at the $0.00000923 lower band.
Market Sentiment: Mixed Signals with Bullish Undercurrent
BTCC financial analyst Mia notes that while Pepe faces some bearish pressure targeting $0.00000700, the market sentiment remains cautiously optimistic. With futures open interest reaching $700 million and price consolidation at key support levels, the ecosystem shows signs of building momentum for a potential September comeback. The mixed signals reflect typical market indecision before a significant move.
Factors Influencing PEPE's Price
PEPE Price Consolidates as Bullish Momentum Builds Despite Minor Decline
PEPE's price action remains subdued, trading with a marginal 0.48% dip over the past 24 hours. The meme coin shows early signs of bullish momentum with its RSI hovering at 51.52—firmly in neutral territory but with room for upward movement. Trading volume remains robust at $77 million on Binance spot markets, signaling sustained interest.
Technical indicators take center stage in the absence of fresh catalysts. The MACD histogram suggests building bullish momentum despite recent weakness, while the broader crypto market's wait-and-see approach creates opportunities for technically-driven trades. No major news events have emerged to disrupt PEPE's consolidation phase.
PEPE Price Consolidates at Key Support as Futures Open Interest Hits $700M
PEPE's price action is consolidating at a critical support zone, with technical indicators aligning around a Gartley Harmonic target. The token holds above the 0.618 Fibonacci retracement and Value Area Low, signaling strong buyer interest. A breakout could propel prices toward leg D of the harmonic pattern.
Futures open interest has surged to $700 million, the highest since early August, reflecting heightened trader participation. While this suggests bullish momentum, it also raises volatility risks. The formation of a falling wedge pattern adds to the bullish case, though whale selling remains a counterweight.
Market structure combines Fibonacci confluence with value area support, creating a potential springboard for upward movement. The key question is whether PEPE can sustain momentum to overcome resistance levels and validate the harmonic setup.
PEPE Price Faces Bearish Pressure with $0.00000700 Target Amid Mixed Signals
PEPE's price trajectory shows increasing bearish momentum, with analysts projecting a decline to $0.00000700 by month-end. The meme coin has seen consistent downward revisions in forecasts, dropping 11% in targets over three days. Technical indicators present conflicting views—while RSI remains neutral, momentum signals suggest further downside.
Changelly's repeated adjustments reflect institutional consensus on PEPE's weakening technical structure. The $0.00000650-$0.00000750 range now serves as critical support, with $0.00000900 acting as distant resistance. Such coordinated pessimism among analysts underscores the asset's vulnerability to continued selling pressure.
Will Pepecoin (PEPE) Deliver a Powerful Comeback in September 2025?
Pepecoin (PEPE), a leading memecoin with a market cap of $4.45 billion, shows mixed signals as it navigates volatile cryptocurrency markets. The MACD indicator hints at a bullish trend, while the Moving Average suggests bearish pressure. Trading at $0.00001059, PEPE faces resistance at $0.00001071—a breakout could propel it toward $0.00001200, but failure risks a drop to $0.00000955.
Community enthusiasm and meme culture continue to fuel PEPE's relevance, even as technical indicators diverge. The coin's 24-hour trading volume of $483.05 million underscores active speculation. Market watchers are split: some see the MACD crossover as a buying signal, while others caution against the Moving Average's overhead resistance.
Will PEPE Price Hit 1?
Based on current technical analysis and market conditions, BTCC financial analyst Mia indicates that PEPE reaching $1 is highly improbable in the foreseeable future. The token would require astronomical growth of over 95,000,000% from its current price of $0.00001051. While bullish momentum is building for short-term gains, fundamental market dynamics and tokenomics make such extreme price targets unrealistic.
| Current Price | Target Price | Required Growth | Feasibility |
|---|---|---|---|
| $0.00001051 | $1.00 | 9,514,000% | Extremely Low |
